|
|
|
Vision
Integrity
Perspective |
| File Transfer Time Chart |
First Published: May 1, 2003
Last Revised: March 15, 2011 |
|
Transfer Time
Summary |
|
Mbps |
MBps |
MBpm |
|
10MB |
100MB |
1GB |
1TB |
| 0.033 |
0.004 |
0.248 |
| 0:40:24 |
6:44:02 |
67:20:24 |
2805 |
| 1 |
0.125 |
7.500 |
| 0:01:20 |
0:13:20 |
2:13:20 |
92.6 |
| 5 |
0.625 |
38 | | 0:00:16 |
0:02:40 |
0:26:40 |
18.5 |
| 10 |
1.25 |
75 | | 0:00:08 |
0:01:20 |
0:13:20 |
9.3 |
| 25 |
3.13 |
188 | | 0:00:03 |
0:00:32 |
0:05:20 |
3.7 |
| 50 |
6.25 |
375 | | 0:00:02 |
0:00:16 |
0:02:40 |
1.9 |
| 100 |
12.5 |
750 | | 0:00:01 |
0:00:08 |
0:01:20 |
22:13:00 |
| 1,000 |
125 | 7500 |
| 0:00:00 |
0:00:01 |
0:00:08 |
2:13:00 |
| 10,000 |
1250 |
75000 |
| 0:00:00 |
0:00:00 |
0:00:01 |
0:13:20 |
|
|
Transfer Rate |
|
KBps |
Mbps |
|
Mbps |
KBps |
| 50 |
0.4 |
| 1 |
125 |
| 100 |
0.8 |
| 2 |
250 |
| 500 |
4 |
| 5 |
625 |
| 1,000 |
8 |
| 10 |
1,250 |
| 5,000 |
40 |
| 50 |
6,250 |
| 10,000 |
80 |
| 100 |
12,500 |
| 50,000 |
400 |
| 500 |
62,500 |
| 100,000 |
800 |
| 1000 |
125,000 | | 500,000 | 1600 | | 2000 | 250,000 |
|

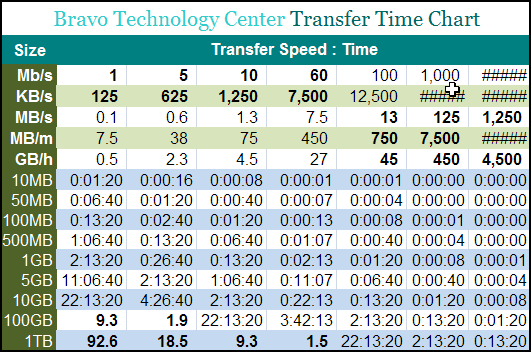
Pick a column that approximates your
expected upload speed (in Kbps/KBps). Then pick a row
that is close to your file size. The time is in
HH:MM:SS (except for a few very large size, low speed
transfer, which are expressed in number of days). Typical Internet users can expect
300-600 Kbps upload.
The right side of the chart is for
Local Area Network (LAN)
transfer. The 3 columns represent different Ethernet
speeds:
10 BaseT, 100 BaseT & Gigabit Ethernet, across
typical light traffic networks, from one computer hard
drive to another computer hard drive. Note that with
these relatively high speed lines (unlike the Internet),
actual through-put is not even close to the theoretical
rated speed, as other bottlenecks and overheads are
becoming more significant. DVD Transfer Time Chart

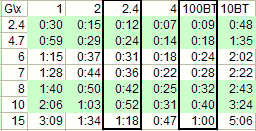
This is a look-up table to the time it
takes to burn a DVD or transfer the image across the
network.
For example: A disc containing 8
Gigabyte would take 42 minutes to burn on a 2.4x burner,
and 32 minutes to copy over 100 BaseT network under
ideal conditions (no other traffic). |